This report documents the frequencies, rates, trends, and characteristics of ambulatory health care visits in 2022 of active component members of the U.S. Army, Navy, Air Force, and Marine Corps. Ambulatory visits by U.S. service members in fixed military and non-military (reimbursed through the Military Health System) medical treatment facilities are documented by standardized records routinely archived for health surveillance purposes in the Defense Medical Surveillance System. Ambulatory visits not routinely and completely documented within fixed military and non-military medical treatment facilities (e.g., during deployments, field training exercises, or at sea) are not included in this analysis.
This year marks the first for which data from the DMSS were housed and analyzed from the Military Health System Information Platform. As part of the continuing transition to MIP, data quality assessments for completeness and timeliness are ongoing. Thus, data presented in this report are considered provisional but current as of March 27, 2023.
As in prior MSMR reports, all records of ambulatory visits of active component service members were categorized according to the International Classification of Diseases, 10th Revision codes entered in the primary (first-listed) diagnostic position of the visit records. Incidence rates were calculated per 1,000 p-yrs. Percent change in incidence was calculated using unrounded rates.
What are the new findings?
Provisional data indicate that the 2022 rate of ambulatory visits in U.S. military and non-military medical facilities was 14.6% lower than the rate observed in 2021. This decline was due to reduced administrative (ICD-10 Z code) visits. The ranked distribution of primary causes for ambulatory visits has remained stable, with disorders of the musculoskeletal system, mental disorders, and nervous system/sense organs accounting for the three most prevalent rates of illness- and injury- related major diagnostic groups.
What is the impact on readiness and force health protection?
The crude annual rate of 9.6 visits per person-year (p-yr) for ambulatory visits for illnesses and injuries in 2022 was slightly higher than the rates in 2020 (8.6 visits per p-yr) and 2018 (9.3 visits per p-yr). The ambulatory visit rate among active component service members far exceeds civilian health care encounters; future analyses comparing the major diagnostic category rates among these two groups may help better define cost of readiness.
Frequencies, rates, and trends
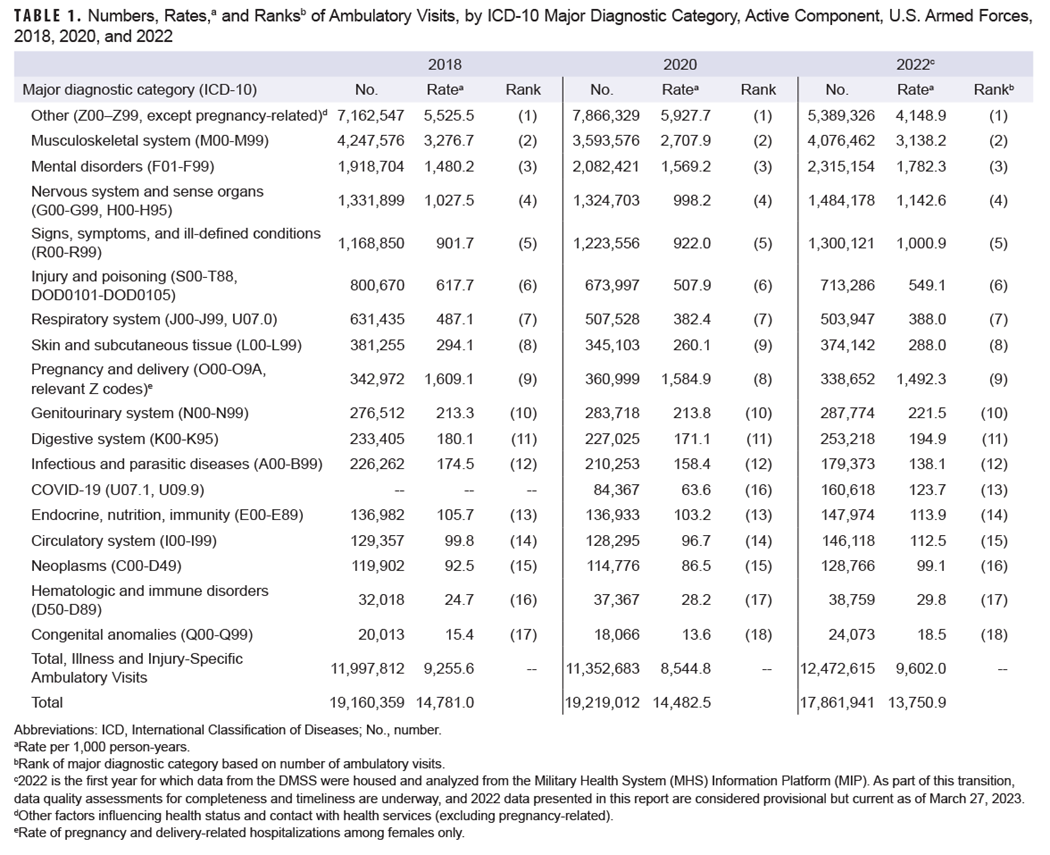
In 2022, active component service members made 17,861,941 ambulatory visits for health care, resulting in a crude annual rate (all causes) of 13,750.9 visits per 1,000 p-yrs or 13.8 visits per p-yr (Table 1).
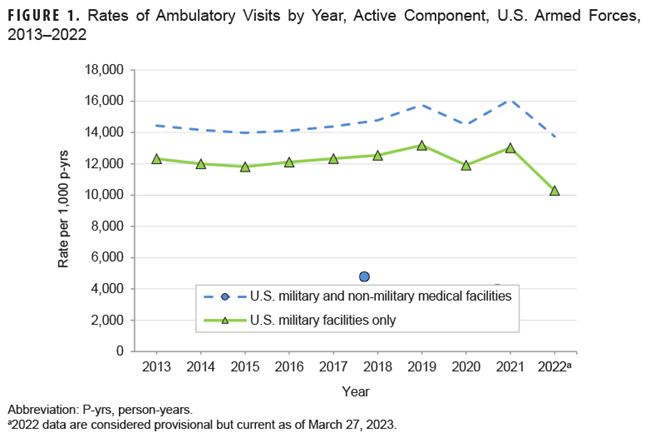
Provisional data indicate that this rate was the lowest observed in the past 10 years, declining from its peak in 2021 (Figure 1). This decline was driven by a reduction in administrative (ICD-10 Z code) visits.
The 12,472,615 documented ambulatory visits in 2022 for illnesses and injuries (ICD-10: A00–T88, including relevant pregnancy Z-codes) not including diagnoses classified as “Other” resulted in a crude annual rate of illness- and injury-related visits of approximately 9.6 per p-yr (Table 1). The crude annual rate of ambulatory visits for illness and injury in 2022 was slightly higher than the rates in 2020 (8.6 visits per p-yr) and 2018 (9.3 visits per p-yr).
As in prior years, the “Other” major diagnostic category, i.e., other factors influencing health status and contact with health services, excluding pregnancy, accounted for the highest rank number of ambulatory visits (Table 1). This care is identified by a “Z code” in the first diagnostic position, which is not generally billable to insurance and normally utilized for administrative and other agency-specific requirements. The military uses Z codes to document some of the health care system burden imposed by readiness requirements; examples include routine and special medical examinations, e.g., periodic, occupational, or retirement, along with immunizations, counseling, deployment-related assessments, suspected exposure to infectious diseases, and screening. From 2018 to 2022, over half of visits attributed to this major diagnostic category included 3 ICD-10 Z codes: encounters for administrative examinations (Z02; n=11,544,607), immunization (Z23; n=4,739,324), and other special examinations without complaint, suspected or reported diagnosis (Z01; n=3,814,985), which includes examinations for eyes and vision, ears and hearing, blood pressure, dental examination and cleanings, and gynecological exams (data not shown).
Ambulatory visits, by ICD-10 major diagnostic categories
In 2022, four major diagnostic categories accounted for almost three-quarters (73.6%) of all illness- and injury-related ambulatory visits by active component service members (not including “Other” diagnoses): musculoskeletal system/connective tissue disorders (32.7%); mental health disorders (18.6%); disorders of the nervous system and sense organs (11.9%); and signs, symptoms, and ill-defined conditions (10.4%) (Table 1). Among visits for illness and injury, COVID-19 caused 1.3% of visits in 2022, a minor increase from 1.1% in 2021 (data not shown).
In general, the relative distributions of ambulatory visits by ICD-10 diagnostic categories remained stable throughout the surveillance period (Table 1). Provisional data indicate that the rate of ambulatory visits increased in nine major diagnostic categories of illness and injury from 2018 to 2022 (Table 1). The rate of mental health conditions increased by 20.4% from 2018 to 2022, with adjustment disorders accounting for the leading diagnosis in this major diagnostic category (Table 1; Table 2; Table 3).
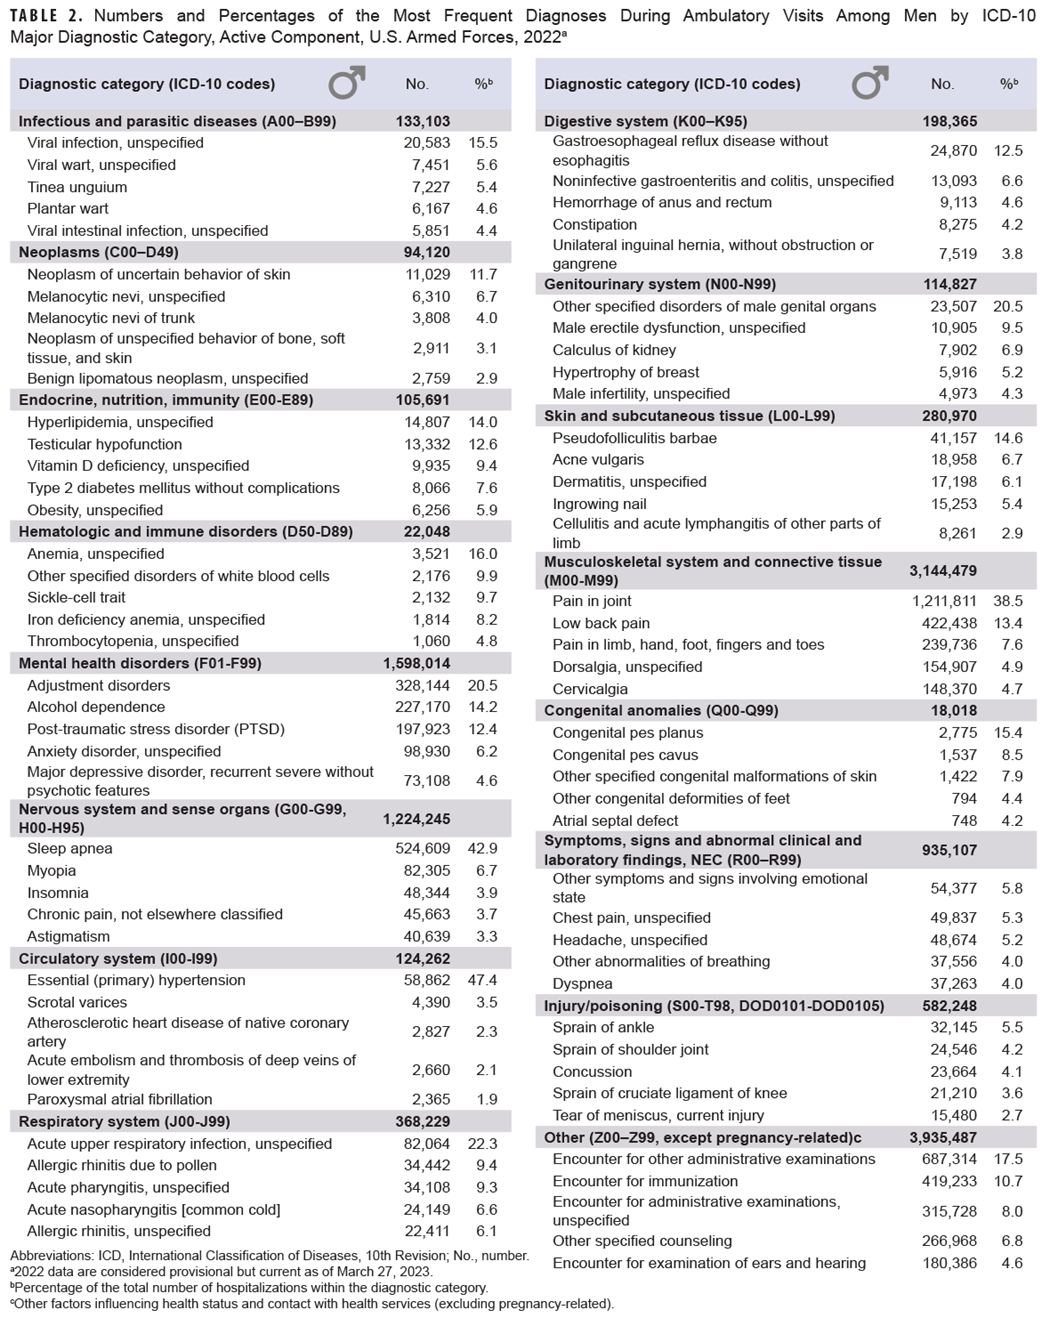
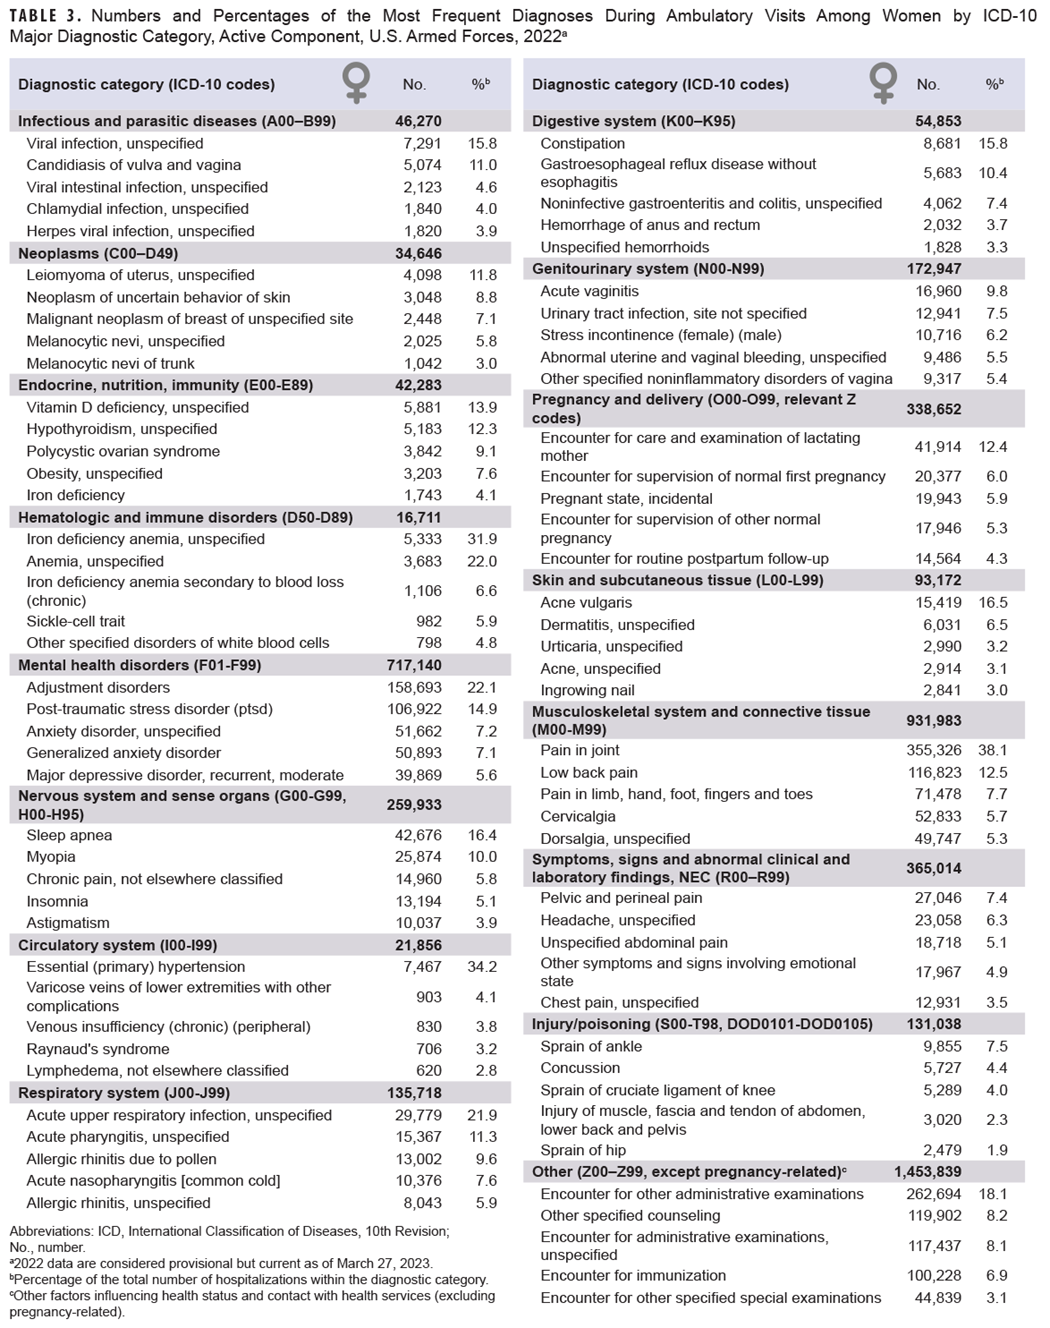
The encounter rate increase for congenital anomalies and hematologic and immune disorders from 2018 through 2022 also exceeded 20%, although the absolute change in the frequency of encounters for these conditions remained the lowest of all major diagnostic categories (Table 1). While congenital anomalies were not a most frequent diagnosis among women, almost 25% of the congenital anomaly conditions in men were diagnosed as congenital pes planus (flat foot) and congenital pes cavus (high arch) in 2022 (Table 2). Unspecified anemia represented the top diagnosis under hematologic and immune disorders for both men and women (Table 2; Table 3).
From 2018 through 2022, the largest declines of illness and injury-specific major diagnostic categories were observed for infectious and parasitic diseases (-20.9%), respiratory system disorders (-20.4%), and injury (-11.1%) (Table 1). While these data are considered provisional, ongoing investigations on data timeliness may indicate these declines are not as substantial. Unspecified viral infection and unspecified acute upper respiratory infection were the leading diagnoses in 2022 for infectious and parasitic diseases and disorders of the respiratory system, respectively (Table 2; Table 3). Consistent with prior years, diagnostic S codes (injury), as opposed to T codes (burns and poisonings), accounted for nearly 90% of all ambulatory encounters within this major diagnostic category (data not shown).
Ambulatory visits, by sex
In 2022, service men accounted for nearly three-fourths (72.7%) of all illness- and injury-related visits; however, the annual crude rate among service women (15.0 visits per p-yr) was 77.5% higher than the rate among men (8.5 visits per p-yr) (data not shown). Excluding pregnancy- and delivery-related visits (which accounted for 9.9% of all non-Z-coded ambulatory visits by women), the illness and injury ambulatory visit rate among women, 13.5 per p-yr, was 60% higher than the rate among men.
The female rates of illness- and injury-specific diagnoses exceeded male rates by 50% in all major diagnostic categories, except for diagnoses relating to nervous system and sense organs, circulatory system, digestive system, musculoskeletal system/connective tissue, and injury (data not shown). Relationships between age group and ambulatory visit rates were broadly similar among men and women across diagnostic categories (Figure 2).
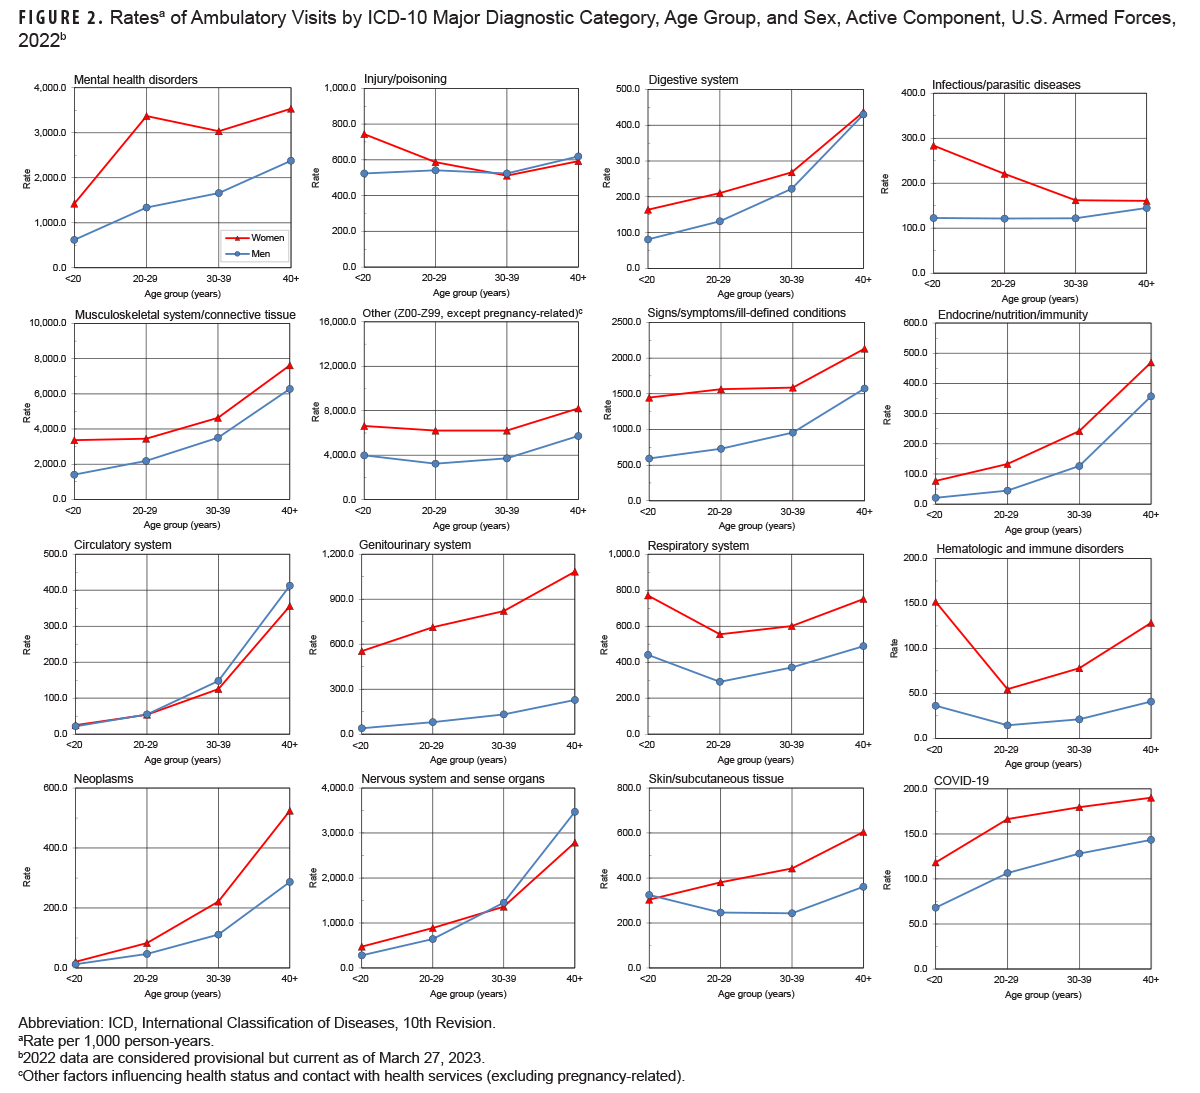
Ambulatory rates for neoplasms, nervous system and sense organ disorders, circulatory system disorders, and endocrine, nutrition and immunity issues rose more steeply with advancing age than other categories of illness or injury (Figure 2). Ambulatory visit rates for COVID-19 infection diagnoses were relatively stable with advancing age.
The four leading diagnoses among ambulatory visits were the same for both male and female service members, although the rates for women exceeded those among men: pain in joint (women: 1,565.8; men: 1,130.4; female: male rate ratio [RR]: 1.4); low back pain (women: 514.8; men: 394.1; RR: 1.1); adjustment disorders (women: 699.3; men: 306.2; RR: 2.3); and pain in the limb, hand, foot, fingers, or toes (female: 315.0; male: 223.6; RR: 1.4) (data not shown). Five other diagnoses were among the 10 most common diagnoses for both men and women: post-traumatic stress disorder; cervicalgia (neck pain); dorsalgia (back pain); unspecified anxiety disorder; and sleep apnea. Sleep apnea was the second-most frequent illness- or injury-specific primary diagnosis for men during ambulatory visits but ranked 10th for women. The difference in the rate rank order of mental disorders is also worth noting: While alcohol dependence was the sixth most frequent diagnosis among men, it was not identified among 10 leading causes of ambulatory visits for women (Table 2, Table 3).
Discussion
Ambulatory visits among active component service members in 2022 declined to the lowest rate observed in the last 10 years; however, this overall decline was affected by a substantial change in the rate of ambulatory visits for “Other” factors influencing health status and health service contact. When excluding visits documented by ICD-10 Z-codes, the rate of illness- and injury-specific ambulatory visits was elevated compared to 2018 and 2020. The ranked distribution of primary causes of ambulatory visits remained stable, with musculoskeletal system, mental, and nervous system and sense organ disorders accounting for the 3 most prevalent rates among illness and injury-related major diagnostic groups.
Notably, since 2018 the rate of ambulatory visits for mental health disorders increased by 20%. The rate of COVID-19 encounters also increased from 2020 to 2022, which partly reflects administrative coding procedures, as the ICD-10 code for COVID-19 was not available until April 2020. Conversely, encounter rate for the infectious disease and respiratory system major diagnostic categories declined by over 20% from 2018 to 2022. The data presented in this report are considered provisional, and ongoing investigations for data completeness in the MHS MIP may indicate a change in trends reported here.
While the National Ambulatory Medical Care Survey of 2019 indicates that civilian women use health care services more than men (3.7 vs. 2.7 visits per p-yr, respectively), the sex-specific rate ratio for illness and injury-specific ambulatory encounters indicates a larger disparity among active component service members (15.0 vs. 8.5 visits per p-yr, respectively).1 Furthermore, the rate of ambulatory office visits among civilians 15-24 years of age (1.6 visits per p-yr) and 25-44 years of age (2.0 visits per p-yr) far exceed the crude annual rate of illness- and injury-related visits (9.6 visits per p-yr) among active duty service members.1 Future analyses comparing the major diagnostic category rates to civilian counterparts may be useful to further define cost of readiness.
Several limitations should be considered when interpreting these findings. Ambulatory care at the unit level by non-credentialed providers and at deployed medical treatment facilities (including ships at sea) are not included. This summary does not reflect the fact that the nature and rates of illnesses and injuries may vary between deployed and non-deployed active component service members.
The transition to a new MHS electronic health record system, MHS GENESIS, has introduced new limitations. In prior MSMR reports, dispositions following ambulatory visits described a proportion of encounters classified as limited duty, convalescence in quarters, or no limitation. These findings were not included in this report, due to a substantial increase in missing disposition data. Disposition information may be included in future reports if data completeness issues are resolved. Prior reports have described the number of virtual versus in-person ambulatory encounters; however, data quality issues have also been identified regarding the variable delineating this encounter type and is an area of active inquiry. Finally, medical data from sites using MHS GENESIS between July 2017 and October 2019 were not available in the DMSS—these sites include Naval Hospital Oak Harbor, Naval Hospital Bremerton, Air Force Medical Services Fairchild, and Madigan Army Medical Center. Medical encounter data for individuals seeking care at any of these facilities from July 2017 through October 2019 were not included in the 2018 comparison data.
This summary is based on primary (first-listed) diagnosis codes reported on ambulatory visit records, and the current summary discounts morbidity related to comorbid and complicating conditions that may have been documented in secondary diagnostic positions in health care records. The accuracy of reported diagnoses likely varies by medical condition, clinical setting, care provider, and treatment facility, as this information is not collected for health surveillance. Although specific diagnoses during individual encounters were potentially not definitive, final, or even correct, summaries of the frequencies, nature, and trends of ambulatory encounters among active component members provide descriptive evidence for further research and evaluation.
Rates and frequencies reported herein do not reflect unique individuals, but a rate of total ambulatory visits per p-year. This report documents all ambulatory health care visits but does not estimate incidence rates for the diagnoses described. These data provide descriptors for health care use, which elevate rates for disorders requiring increased numbers of ambulatory visits. In contrast to common, self-limited, and minor illnesses and injuries that require very little, if any, follow-up or continuing care, illnesses and injuries necessitating multiple ambulatory visits for evaluation, treatment, and rehabilitation are over-represented in this summary.
Finally, the dataset is incomplete. Encounter data continues to be reported well after data are extracted from DMSS via the MHS MIP. The timing of data reporting varies annually, affecting direct comparisons to prior reports. While the relative rank order of utilization categories is most likely representative of the full data set, the absolute values are likely underestimated by 10-15%.
Reference
- National Ambulatory Health Care Survey: 2019 National Summary. Accessed June 12, 2023. https://www.cdc.gov/nchs/data/ahcd/namcs_summary/2019-namcs-web-tables-508.pdf